Production
The batch, not only the gauge.
A line screen shows what this shift is making: the product, the batch, the target, and how much is good. OEE, the downtime Pareto and the production events live with that batch. They are not a spreadsheet someone types on Friday.
What the line screen shows
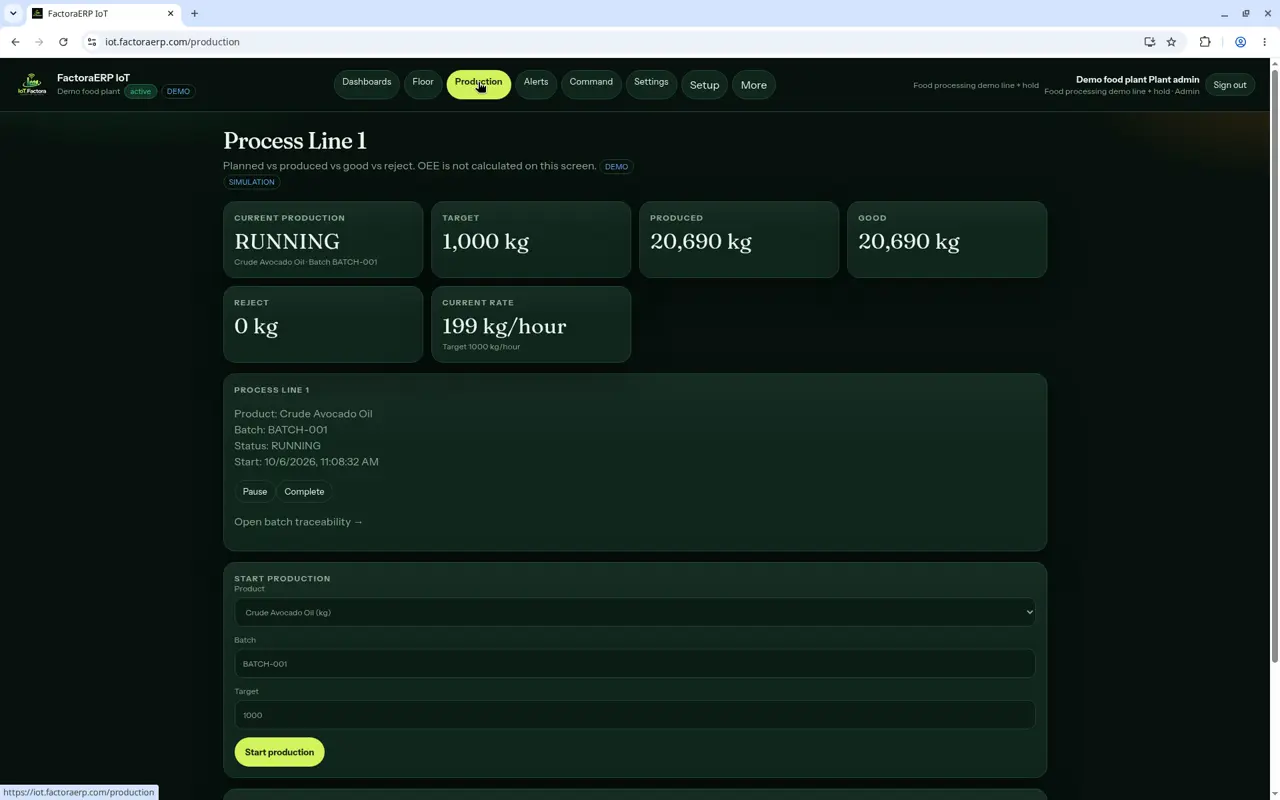
In the Demo food plant, Process Line 1 is running Crude Avocado Oil, batch BATCH-001, against a target of 1,000 kg. The screen shows produced, good and reject, the current rate, and a link into batch traceability. It also says, on the screen, that OEE is not calculated there. Planned versus produced versus good versus reject is the line view. OEE is its own view, with downtime Pareto and production events on the batch. The Process Line screen in the demo says OEE is not calculated there: it shows planned, produced, good and reject. On the Floor of that same demo, the OEE tile reads N/A.
Where OEE actually lives
OEE is a module of its own. Downtime Pareto and the production events for the batch sit with it, so a Monday meeting can see which stoppages ate the shift without retyping the line log. The Floor of the same demo shows an OEE tile at N/A, which is the honest state of that simulated line, not a hidden number.
Temperature on the lot
Tap a card to acknowledge it. The person's name is stored on the alert, not a role code. From the same card you can Resolve it, or open Ask about this. The temperature history of the room is written onto the batch that was inside it, and the plant can produce a PDF compliance report from that record. The compliance page prints a sample of the columns. The capture on this page is the production screen, not that PDF.
The capture is the Demo food plant. The demo simulator can run a power failure, a sensor offline, or a cold room fault. Those are scenarios in the demo plant, not a record from a customer and not a battery test.
Book a demo
See it on your plant in 20 minutes
Bring one batch code and the target you already run to. We will open the line screen and the traceability behind it.